
By Christos Tsiotsios, MSc. — Instructor & MRI Specialist
Medical imaging is undergoing a major transformation. For decades, radiology has relied primarily on visual interpretation — radiologists analyzing grayscale images to identify abnormalities based on contrast differences and anatomical patterns. While this approach remains fundamental, modern imaging is increasingly moving beyond qualitative assessment toward quantitative imaging, where images become sources of measurable data.
This shift is particularly relevant in brain imaging. Neurological diseases such as multiple sclerosis, dementia, or brain tumors often develop gradually. Detecting and monitoring these changes requires more than visual interpretation—it requires objective metrics that describe tissue characteristics and physiological processes.
Quantitative MRI (qMRI) provides exactly that. Instead of relying only on signal intensity, quantitative imaging extracts measurable biomarkers related to physical or biological tissue properties. These metrics allow clinicians to track disease progression, compare findings across time, and support data-driven clinical decisions.
In this article, we explore the fundamentals of quantitative brain imaging: why quantitative MRI is becoming increasingly important, what technical requirements are needed, and how imaging biomarkers such as volumetry, diffusion imaging, and perfusion MRI are used in clinical practice. We also highlight the role of PET/CT, discuss potential technical pitfalls, and examine the essential role radiographers play in ensuring reliable quantitative imaging.
Content
1. Why Quantitative MRI?
2. WHAT IS NEEDED FOR QUANTITATIVE MRI?
3. MR IMAGING BIOMARKERS
4. BEYOND MRI: QUANTIFICATION WITH PET/CT
5. TECHNICAL PITFALLS IN QUANTITATIVE IMAGING
6. THE RADIOGRAPHER'S ROLE IN QUANTITATIVE MRI
7. SUMMARY
SOURCES
1. Why Quantitative MRI?
Conventional MRI highlights anatomical differences through contrast-weighted images, which radiologists interpret visually. A lesion may appear hyperintense on T2-weighted images or hypointense on T1-weighted scans.
However, this approach has limitations. Visual interpretation can be subjective, and small differences in acquisition parameters may influence signal intensity. As a result, findings can sometimes be difficult to compare across examinations.
Quantitative MRI addresses this limitation by transforming images into measurable physical parameters. Instead of describing a lesion qualitatively, qMRI can determine numerical values such as relaxation times, diffusion coefficients, or perfusion metrics.
For example, with T2 mapping a lesion is no longer simply “bright”—it exhibits a measurable T2 relaxation time that reflects tissue composition. These measurements are reproducible and comparable over time.
In essence, quantitative MRI represents a shift from imaging as visualization to imaging as measurement.
2. WHAT IS NEEDED FOR QUANTITATIVE MRI?
Reliable quantitative imaging requires a stable and standardized imaging environment.
Several key components are essential:
High-performance hardware
MRI systems must deliver stable gradients, consistent RF performance, and reliable calibration. This includes a high magnetic field (at least 1.5T), powerful gradients, and multichannel RF coils to ensure sufficient signal-to-noise ratio and spatial resolution for precise quantification.
Standardized acquisition protocols
Consistent imaging parameters ensure that quantitative values remain comparable across scans (e.g., slice thickness must remain the same — you can’t scan with 5 mm today and 4 mm at the next follow-up).
Advanced post-processing software
Dedicated tools convert signal changes into quantitative maps and numerical data, such as diffusion or perfusion parameters.
Well-trained personnel
Radiographers and standardized workflows — including Standard Operating Procedures (SOPs) — are essential to ensure reproducible acquisition and reliable results.
3. MR IMAGING BIOMARKERS
Quantitative MRI generates measurable parameters that serve as imaging biomarkers — objective indicators of biological processes or disease.
Here is an overview of the most relevant qMRI biomarkers:
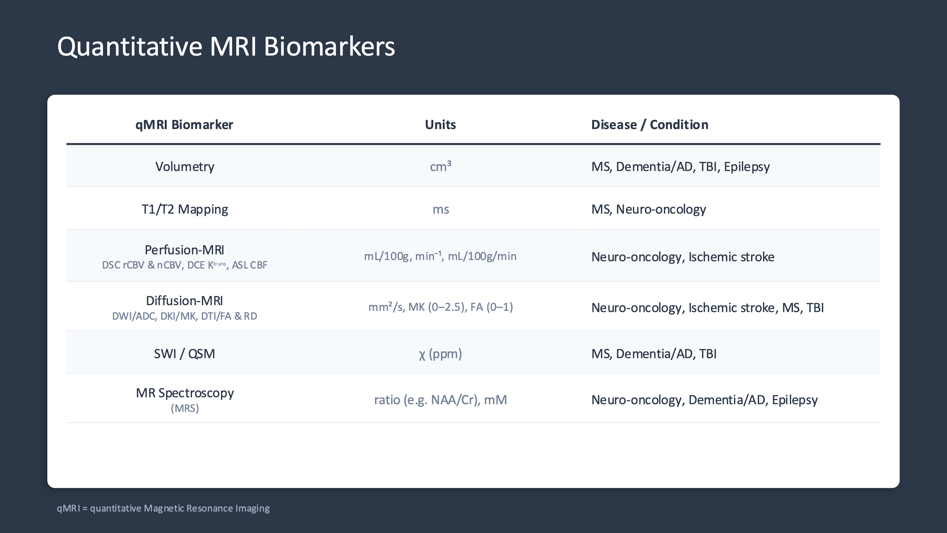
Figure 1: The main MRI biomarkers summarized. Courtesy of Christos Tsiotsios (Author).
Volumetry
Volumetric analysis plays a key role in the assessment of neurological disorders such as multiple sclerosis and dementia.
Rather than relying on subjective visual counting, dedicated software automatically quantifies the total lesion burden in cubic centimeters (cm³) and determines the lesion load as a percentage of white matter. In addition, it measures brain parenchymal volume by performing automated segmentation of key brain structures—including cortical gray matter, cerebral white matter, thalami, and hippocampi—and compares these volumes with age-matched normative reference databases.
These volumes are expressed as percentiles. When brain volume falls below the 5th percentile, this provides objective evidence of pathological atrophy rather than normal aging.
This quantitative approach enables clinicians to monitor disease progression more accurately and supports more objective, data-driven diagnoses.
Diffusion mRI
Diffusion MRI provides insight into the microstructure of brain tissue by measuring the movement of water molecules.
This is particularly valuable in brain tumors. While conventional sequences may show lesion location and edema, diffusion imaging reveals changes within the tissue itself.
Apparent Diffusion Coefficient (ADC) mapping serves as a fundamental quantitative tool in neuro-oncology (Figure 4). In this representative case of high-grade glioma, the solid component of the lesion demonstrates restricted diffusion with a diminished ADC value of 0.92 × 10⁻³ mm²/s, reflecting increased cellular density. Glioblastomas often exhibit such low mean diffusivity values due to restricted water motion from high cellular density. Conversely, the peritumoral vasogenic edema exhibits an elevated ADC value of 1.74 × 10⁻³ mm²/s, consistent with increased extracellular water mobility.
Diffusion kurtosis imaging may additionally show high kurtosis values, indicating the complex microstructural architecture typical of aggressive tumors.
These metrics help characterize tumors beyond what conventional imaging can reveal.
.png?width=1580&height=622&name=image%20(9).png)
Figure 2: Diffusion MRI in a representative case of high-grade glioma. (A) Axial contrast-enhanced T1-weighted image showing the intra-axial mass lesion with surrounding vasogenic edema. (B) Corresponding apparent diffusion coefficient (ADC) map. Quantitative region-of-interest (ROI) analysis demonstrates restricted diffusion in the solid tumor component (yellow ROI: mean ADC = 0.92 × 10⁻³ mm²/s) and elevated diffusivity in the peritumoral vasogenic edema (blue ROI: mean ADC = 1.74 × 10⁻³ mm²/s). (C) Axial diffusion-weighted imaging (DWI, b = 1000 s/mm²) trace image. Courtesy of Christos Tsiotsios (Author).
Perfusion MRI
Perfusion MRI quantifies hemodynamic properties of brain tissue. Perfusion maps represent physiological measurements rather than simple color patterns. Parameters such as relative cerebral blood volume (rCBV) or permeability metrics (e.g., Ktrans) provide insight into vascular activity within lesions (Figure 5).
In tumor follow-up, these values can help distinguish tumor recurrence from radiation necrosis. Regions with high rCBV and permeability typically indicate active tumor tissue, while lower values may suggest treatment-related changes. Such quantitative measurements support more confident clinical decision-making.
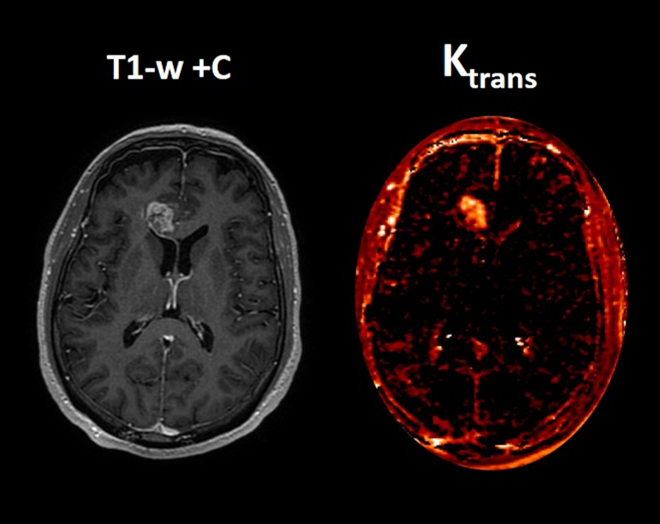
Figure 3. Quantitative dynamic contrast-enhanced (DCE) perfusion MRI in a representative high-grade glioma. (A) Axial post-contrast T1-weighted image (T1-w +C) showing a heterogeneously enhancing intra-axial mass lesion. (B) Corresponding Ktrans map. Quantitative T1 DCE analysis converts signal changes and contrast concentration into specific numerical biomarkers. The solid enhancing component demonstrates markedly elevated Ktrans of 0.13 min⁻¹ (red-yellow areas), reflecting increased vascular permeability and blood–brain barrier disruption. This finding is highly suggestive of an active high-grade neoplastic process (e.g., glioblastoma or metastasis) rather than a low-grade glioma or non-neoplastic inflammatory lesion. Courtesy of Christos Tsiotsios (Author).
4. Beyond MRI: Quantification with PET/CT
Quantitative imaging is not limited to MRI. Nuclear medicine techniques such as PET/CT also rely on measurable biomarkers.
An important example is beta-amyloid PET imaging in Alzheimer’s disease. This method measures amyloid plaque accumulation in the brain.
Instead of describing uptake qualitatively, PET analysis provides standardized uptake ratios for specific brain regions. These metrics enable earlier diagnosis and allow clinicians to track disease progression precisely over time.
Quantitative PET therefore plays a crucial role in modern neuroimaging and therapeutic monitoring.
5. Technical pitfalls in quantitative imaging
Despite its advantages, quantitative imaging introduces new technical challenges.
One of the most important is patient motion. Even small movements during acquisition can distort measurements and compromise quantitative accuracy. Motion artifacts are a common reason for degraded image quality and repeated scans.
Other pitfalls include post-processing errors, such as incorrect region selection during data analysis. Maintaining high data quality throughout the imaging workflow is therefore essential.
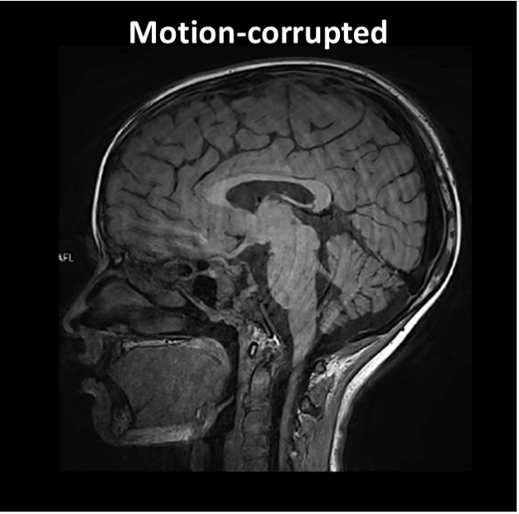
Figure 4: Technical Pitfalls: Example of a motion-corrupted image. Source: Courtesy of Bac Nguyen.
6. The Radiographer's role in quantitative MRI
Radiographers play a crucial role in ensuring reliable quantitative imaging.
Because quantitative metrics are highly sensitive to signal variations, precise patient positioning and immobilization are essential. Even minor movements can influence measurements.
Clear communication with patients and the use of appropriate positioning and immobilization tools help ensure stability throughout the scan.
Radiographers also contribute through technical expertise—for example by implementing advanced acquisition techniques that reduce scan times and minimize motion artifacts (e.g., simultaneous multi-slice DTI acquisition).
Ultimately, quantitative MRI relies not only on technology but also on expert acquisition and workflow management.
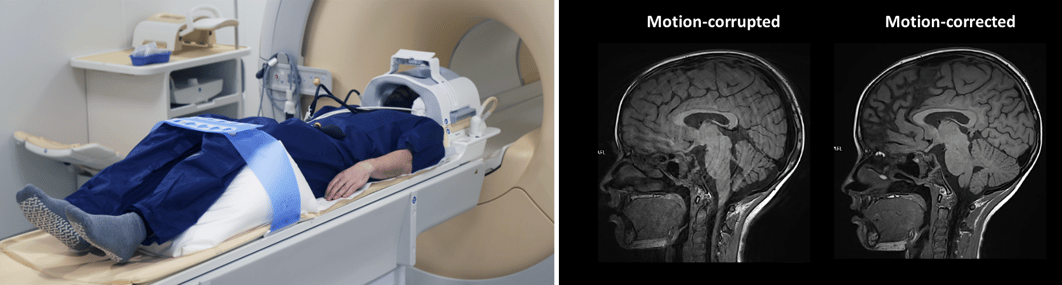
Figure 5: Patient positioned in MRI scanner with MULTIPAD immobilization inside head coil and PearlFit Wedge beneath legs, motion-corrected vs motion-corrupted images. Source: Pearl Technology & Courtesy of Bac Nguyen.
7. Summary
Quantitative brain imaging represents an important step toward data-driven radiology. By transforming images into measurable biomarkers, quantitative MRI improves diagnostic accuracy and enables precise monitoring of neurological diseases.
Techniques such as volumetry, diffusion imaging, and perfusion MRI are already shaping clinical practice, while complementary modalities like PET/CT further extend quantitative assessment.
However, successful implementation depends on standardization, technical expertise, and careful acquisition. From hardware stability to precise patient positioning, every step contributes to reliable results.
As imaging continues to evolve from visual interpretation toward measurable data, quantitative MRI will play an increasingly central role in modern neuroimaging.
Sources
Bac Nguyen, (Communication via Christos Tsiotsios) shared motion corrupted and motion corrected images.
Christos Tsiotsios. Own Figures
Pearl Technology AG. (n.d.). Multipad. Pearl Technology. Retrieved March 31, 2026, from https://www.pearl-technology.ch/en/multipad